Volleyball statistics guide
Volleyball Stats Explained: Abbreviations and Calculation Examples
Reviewed by the Vollyze product team. Definitions are cross-checked against published volleyball statistics guidance and game rules. Where grading systems vary, this guide says so explicitly.
Quick definitions
The main volleyball statistics answer different questions about the same match.
Use the smallest set that explains the coaching decision. Keep every percentage beside its formula and sample size so staff know what the number can and cannot support.
- Hitting % (kills - errors) / attempts
- Passing average weighted reception grade / receptions
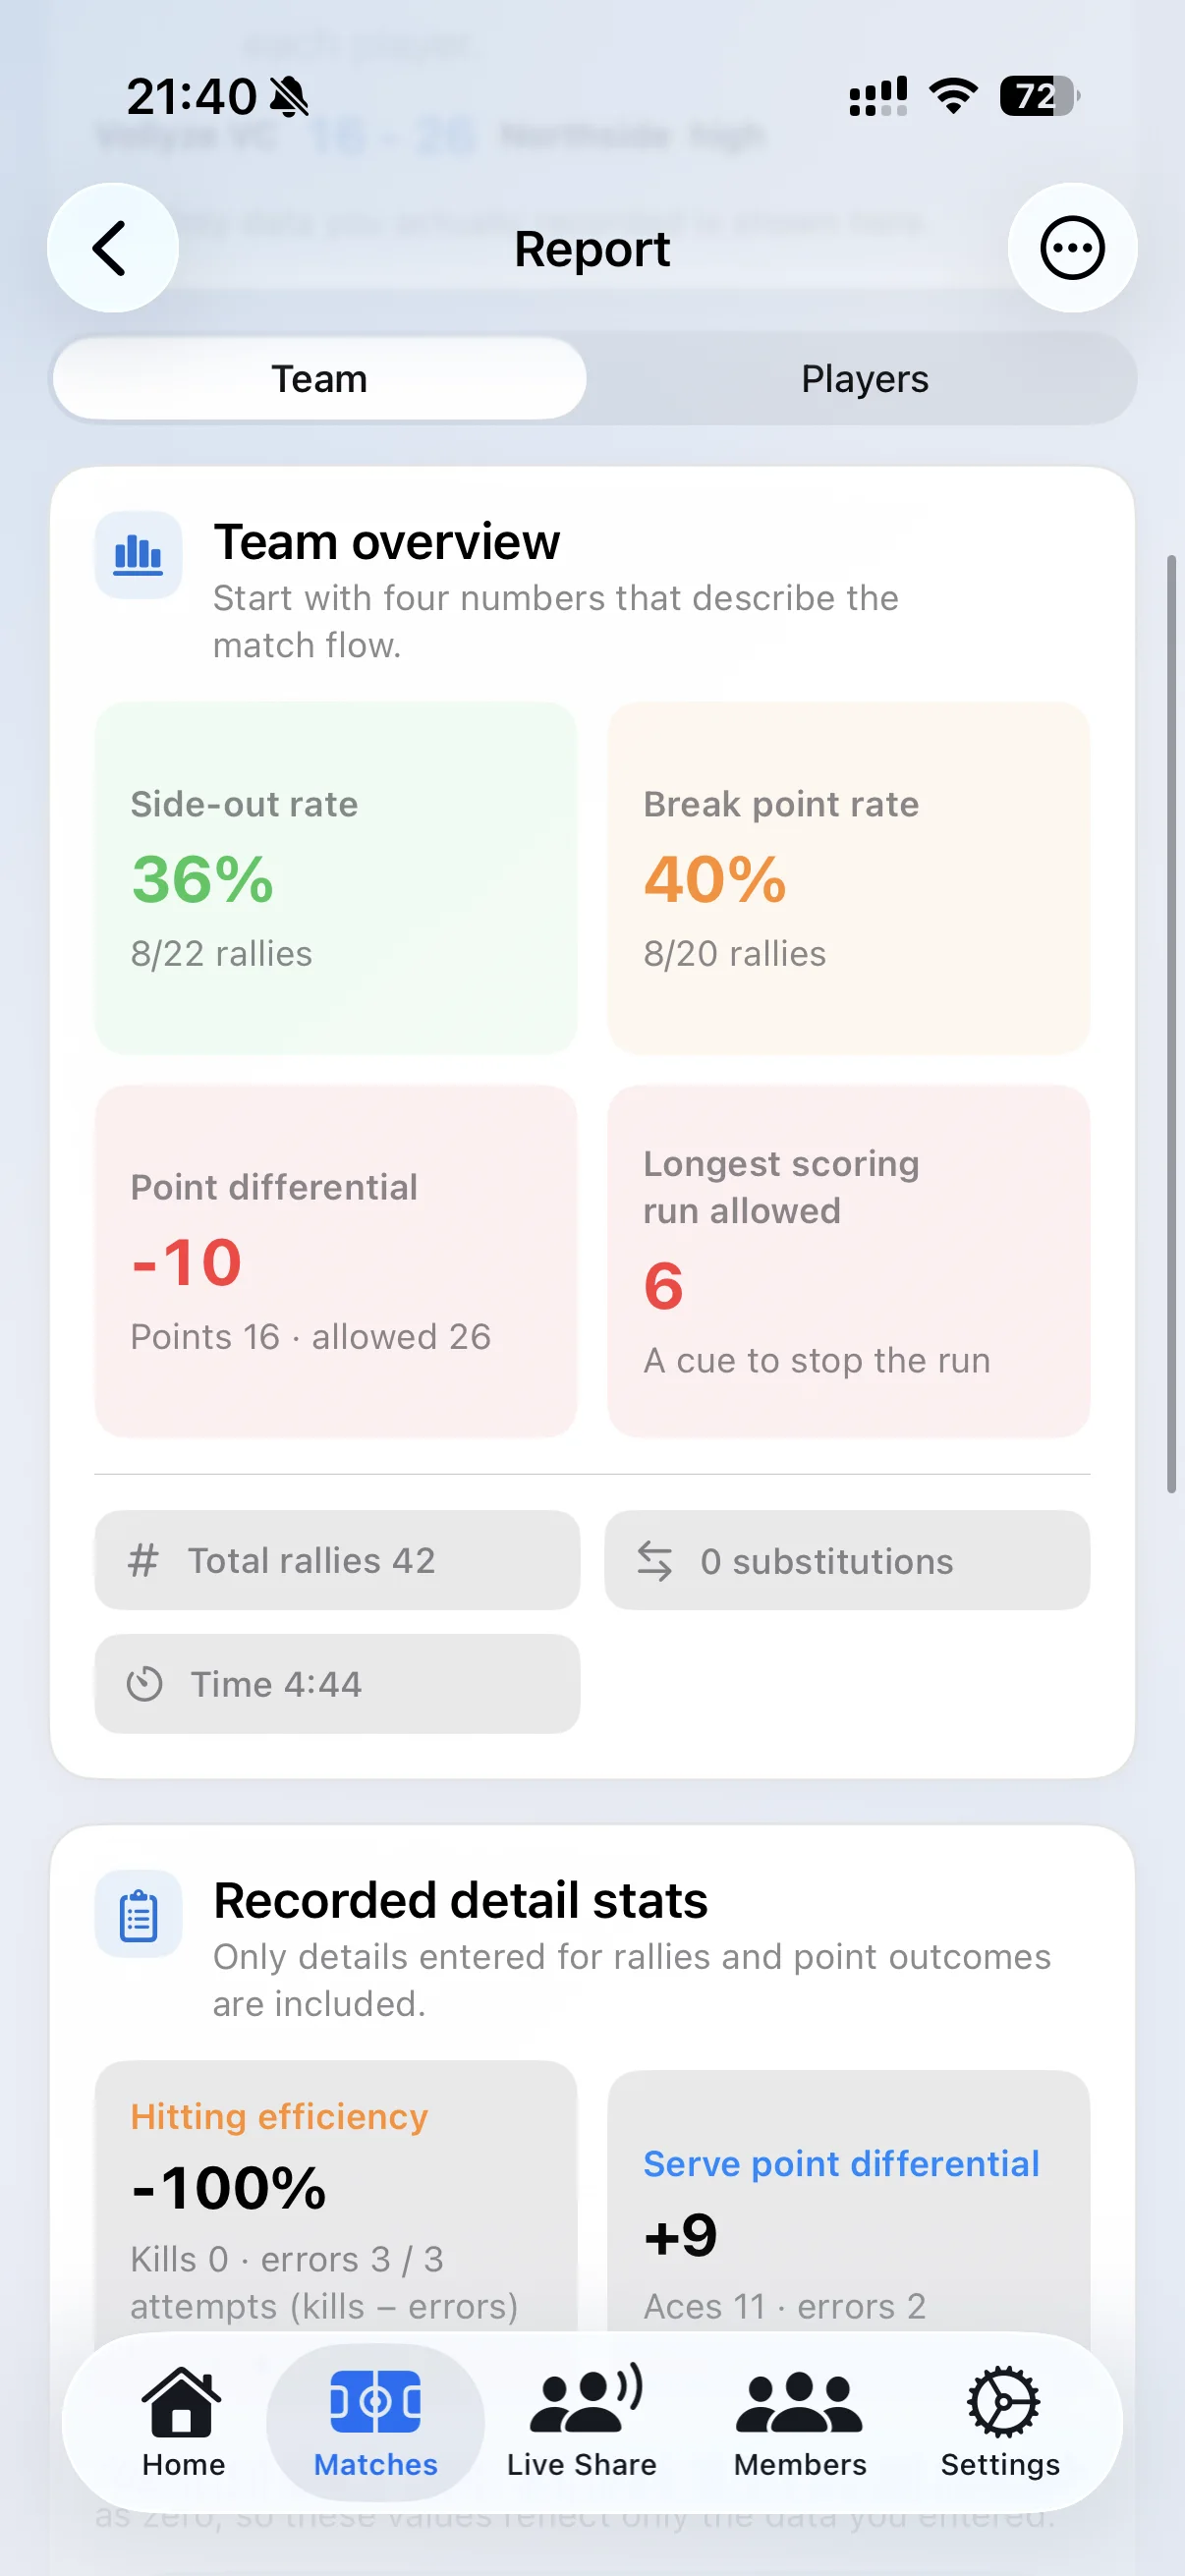
- Side-out % rallies won while receiving / receiving rallies
- Break-point rate rallies won while serving / serving rallies
- Attack statistics describe outcome and efficiency, not the full quality of the offense.
- Serve and reception statistics need consistent definitions and visible sample sizes.
- Side-out and break-point rates separate receiving and serving phases.
- Rotation and scoring-run context help explain when pressure repeated.
- The endpoint should be one practice response the staff can teach and measure.
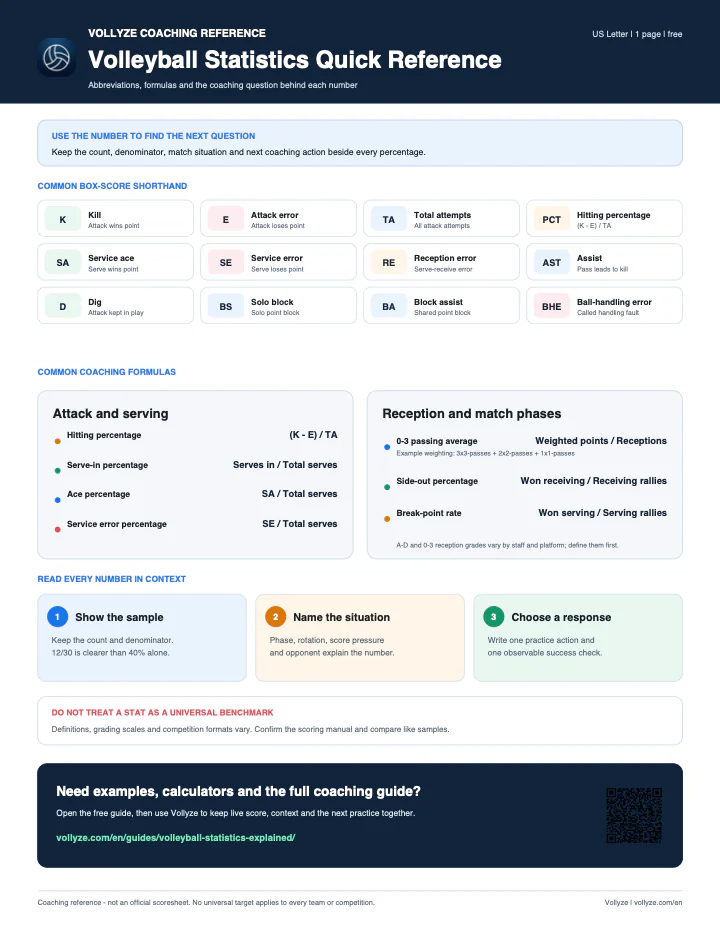
- A free one-page quick reference is available for the bench or staff meeting.
Volleyball statistics can look like a second language: K, E, TA, PCT, SA, SE, RE, AST, BS and BA may appear beside percentages, averages and rotation numbers. The abbreviations are useful, but only when the staff knows what event was counted and what question the number is supposed to answer.
This guide explains the most common volleyball stats and formulas in plain English. It also separates standard box-score language from coaching metrics such as passing average, side-out percentage and rotation point differential. The goal is not to collect every possible event. It is to choose enough evidence to make the next decision more precise.
Free coaching resource
Download the Volleyball Statistics Quick Reference
A one-page printable guide to common abbreviations, formulas and the coaching question behind each number.
- Check K, E, TA, PCT, SA, SE, RE, AST, D, BS, BA and BHE at a glance.
- Keep hitting, serving, passing, side-out and break-point formulas together.
- Read every percentage with its sample, match situation and next practice response.
No sign-up required. Designed for US Letter. Definitions and grading scales can vary, so confirm the scoring manual used by your competition or platform.
Volleyball stats abbreviations: quick-reference table
The table below uses widely recognized definitions. A competition, statistics platform or coaching staff may label some events differently, so check the definitions in the system that produced the report before comparing results.
| Abbreviation | Meaning | Typical definition | Coaching question |
|---|---|---|---|
| K | Kill | An attack that directly results in a point. | Which attacking options finished rallies? |
| E | Attack error | An attack that directly gives the opponent a point. | Did pressure come from risk, selection or execution? |
| TA | Total attempts | Kills, errors and attacks kept in play. | Is the sample large enough to interpret? |
| PCT | Hitting percentage | Kills minus errors, divided by total attempts. | Did the attack create points without giving too many away? |
| SA | Service ace | A serve that directly results in a point. | Where did serving create immediate pressure? |
| SE | Service error | A serve that directly results in a point for the opponent. | Was the serving risk appropriate for the situation? |
| RE | Reception error | A served ball that directly results in a point for the serving team. | Which serve or seam broke the receiving shape? |
| AST | Assist | A set or pass that leads directly to a kill. | Which connections produced successful attacks? |
| D | Dig | A defensive contact that keeps an attacked ball in play. | Did defense create a playable transition opportunity? |
| BS / BA | Solo / block assist | A point-scoring block by one player or a shared block. | Did the block finish the rally or organize the defense? |
| BHE | Ball-handling error | A called handling fault on a set or contact. | Did setting pressure repeatedly remove the intended offense? |
Definition source: the attack, serve, receive, assist, dig and block terminology above follows the WIAA Volleyball Statistics Guide. Always apply the scoring manual used by your own competition.
Attack statistics: kills, errors, attempts and hitting percentage
Attack statistics are most useful when the components stay visible. A hitting percentage alone can hide whether a result came from more kills, fewer errors or a small sample. Keep K, E and TA beside the percentage whenever possible.
Hitting percentage formula
(Kills - Attack errors) / Total attack attempts
Example: 12 kills, 4 errors and 30 attempts produce (12 - 4) / 30 = .267.
A .267 result does not automatically mean the same thing in every match. Compare attack quality, set location, opponent block, rotation and score pressure. If the team stayed efficient only on perfect receptions, the practice question may be about first-contact stability rather than the hitters alone.
Use the free volleyball hitting percentage calculator to separate kill rate, error rate and hitting percentage from the same sample.
Serving statistics: serve-in, ace and error percentages
Serving percentage can refer to different calculations, which is why the label should name the formula. Serve-in percentage measures how often a serve enters play. Ace percentage measures direct scoring. Error percentage measures the immediate cost of serving risk.
| Metric | Formula | Useful question |
|---|---|---|
| Serve-in percentage | Serves in / Total serves | Did the team apply pressure without ending too many rallies immediately? |
| Ace percentage | Aces / Total serves | How often did the serve win the point directly? |
| Service error percentage | Errors / Total serves | What was the immediate cost of the serving plan? |
An ace-error balance still does not show every useful serve. A serve may remove the opponent's preferred attack and create an easier transition without becoming an ace. When rally outcomes are available, add break-point rate to see whether the team won while serving. The serving percentage calculator keeps these formulas separate.
Serve-receive statistics: reception errors and passing average
A reception error is a standard outcome stat. Passing average is a coaching grade that adds more detail about first-contact quality. Many staffs use a 0-3 scale, while others use A-D or a different internal system. These systems are not automatically equivalent.
Passing average on a 0-3 scale
(3 x three-passes + 2 x two-passes + 1 x one-passes) / Total receptions
Example: 8 three-passes, 10 two-passes, 5 one-passes and 2 zero-passes produce 49 points across 25 receptions, for a 1.96 average.
Before recording, define what each grade means in terms of setter access and attack options. A grade should describe the team's intended offense, not only whether the ball stayed in play. Keep the distribution and sample visible because two players can have the same average with very different patterns.
Try the 0-3 passing average calculator for the full formula, an A-D comparison and interpretation cautions.
Side-out percentage and break-point rate
Under rally scoring, every rally awards a point. The receiving team rotates and gains the right to serve when it wins the rally. Separating receiving and serving phases helps the staff see whether pressure starts with side-out or with point scoring behind its own serve.
| Metric | Formula | What it describes |
|---|---|---|
| Side-out percentage | Rallies won while receiving / Total receiving rallies | How often the team regained serve and scored from reception. |
| Break-point rate | Rallies won while serving / Total serving rallies | How often the team scored while keeping the serve. |
Do not combine the denominators. A team with a 50% side-out rate and a 35% break-point rate is describing two separate rally samples. Open the side-out and break-point calculator for worked examples and rotation context.
Game context: see the FIVB basic rules for rally scoring, service and rotation sequence. Competition formats and device-use policies can differ, so confirm the rules that apply to your event.
Rotation statistics and scoring runs
A rotation number is context, not a diagnosis. Rotation point differential, side-out rate by rotation or a scoring run can tell the staff where to inspect the match. It cannot by itself explain whether the cause was serve pressure, reception quality, setter location, matchup or a short sample.
- Rotation point differential: points won minus points lost while the team was in one rotation.
- Side-out by rotation: receiving rallies won divided by receiving rallies in that rotation.
- Scoring run allowed: consecutive points won by the opponent before the team stopped the run.
- Close-score context: rallies that occurred when the score and decision pressure were tight.
Review the score flow before labeling a rotation weak. A 0-3 differential across three rallies means something different from the same differential across twelve. The rotation analysis guide explains how to move from a rotation flag to a trainable situation.
What should a team track first?
The right stat set depends on staff capacity. A single coach with no dedicated recorder should not copy the workload of a program with analysts. Begin with the smallest layer the team can collect consistently, review and use at practice.
| Staff capacity | Start with | Add only when useful | Review question |
|---|---|---|---|
| One recorder | Score, phase and point-loss reason | Rotation or a short player note | Where did the set turn? |
| Coach plus assistant | Score plus selected reception grades | Attack paths or player context | Which repeated context removed the intended offense? |
| Dedicated analyst | A defined coding model tied to video | Opponent, lineup and player-level detail | Which tactical pattern is stable across enough observations? |
Consistency is more valuable than temporary detail. If a metric is recorded for only part of a set, label the sample clearly. If the staff cannot explain how a number will change a meeting or practice, stop collecting it until a real question appears.
Turn match statistics into one practice decision
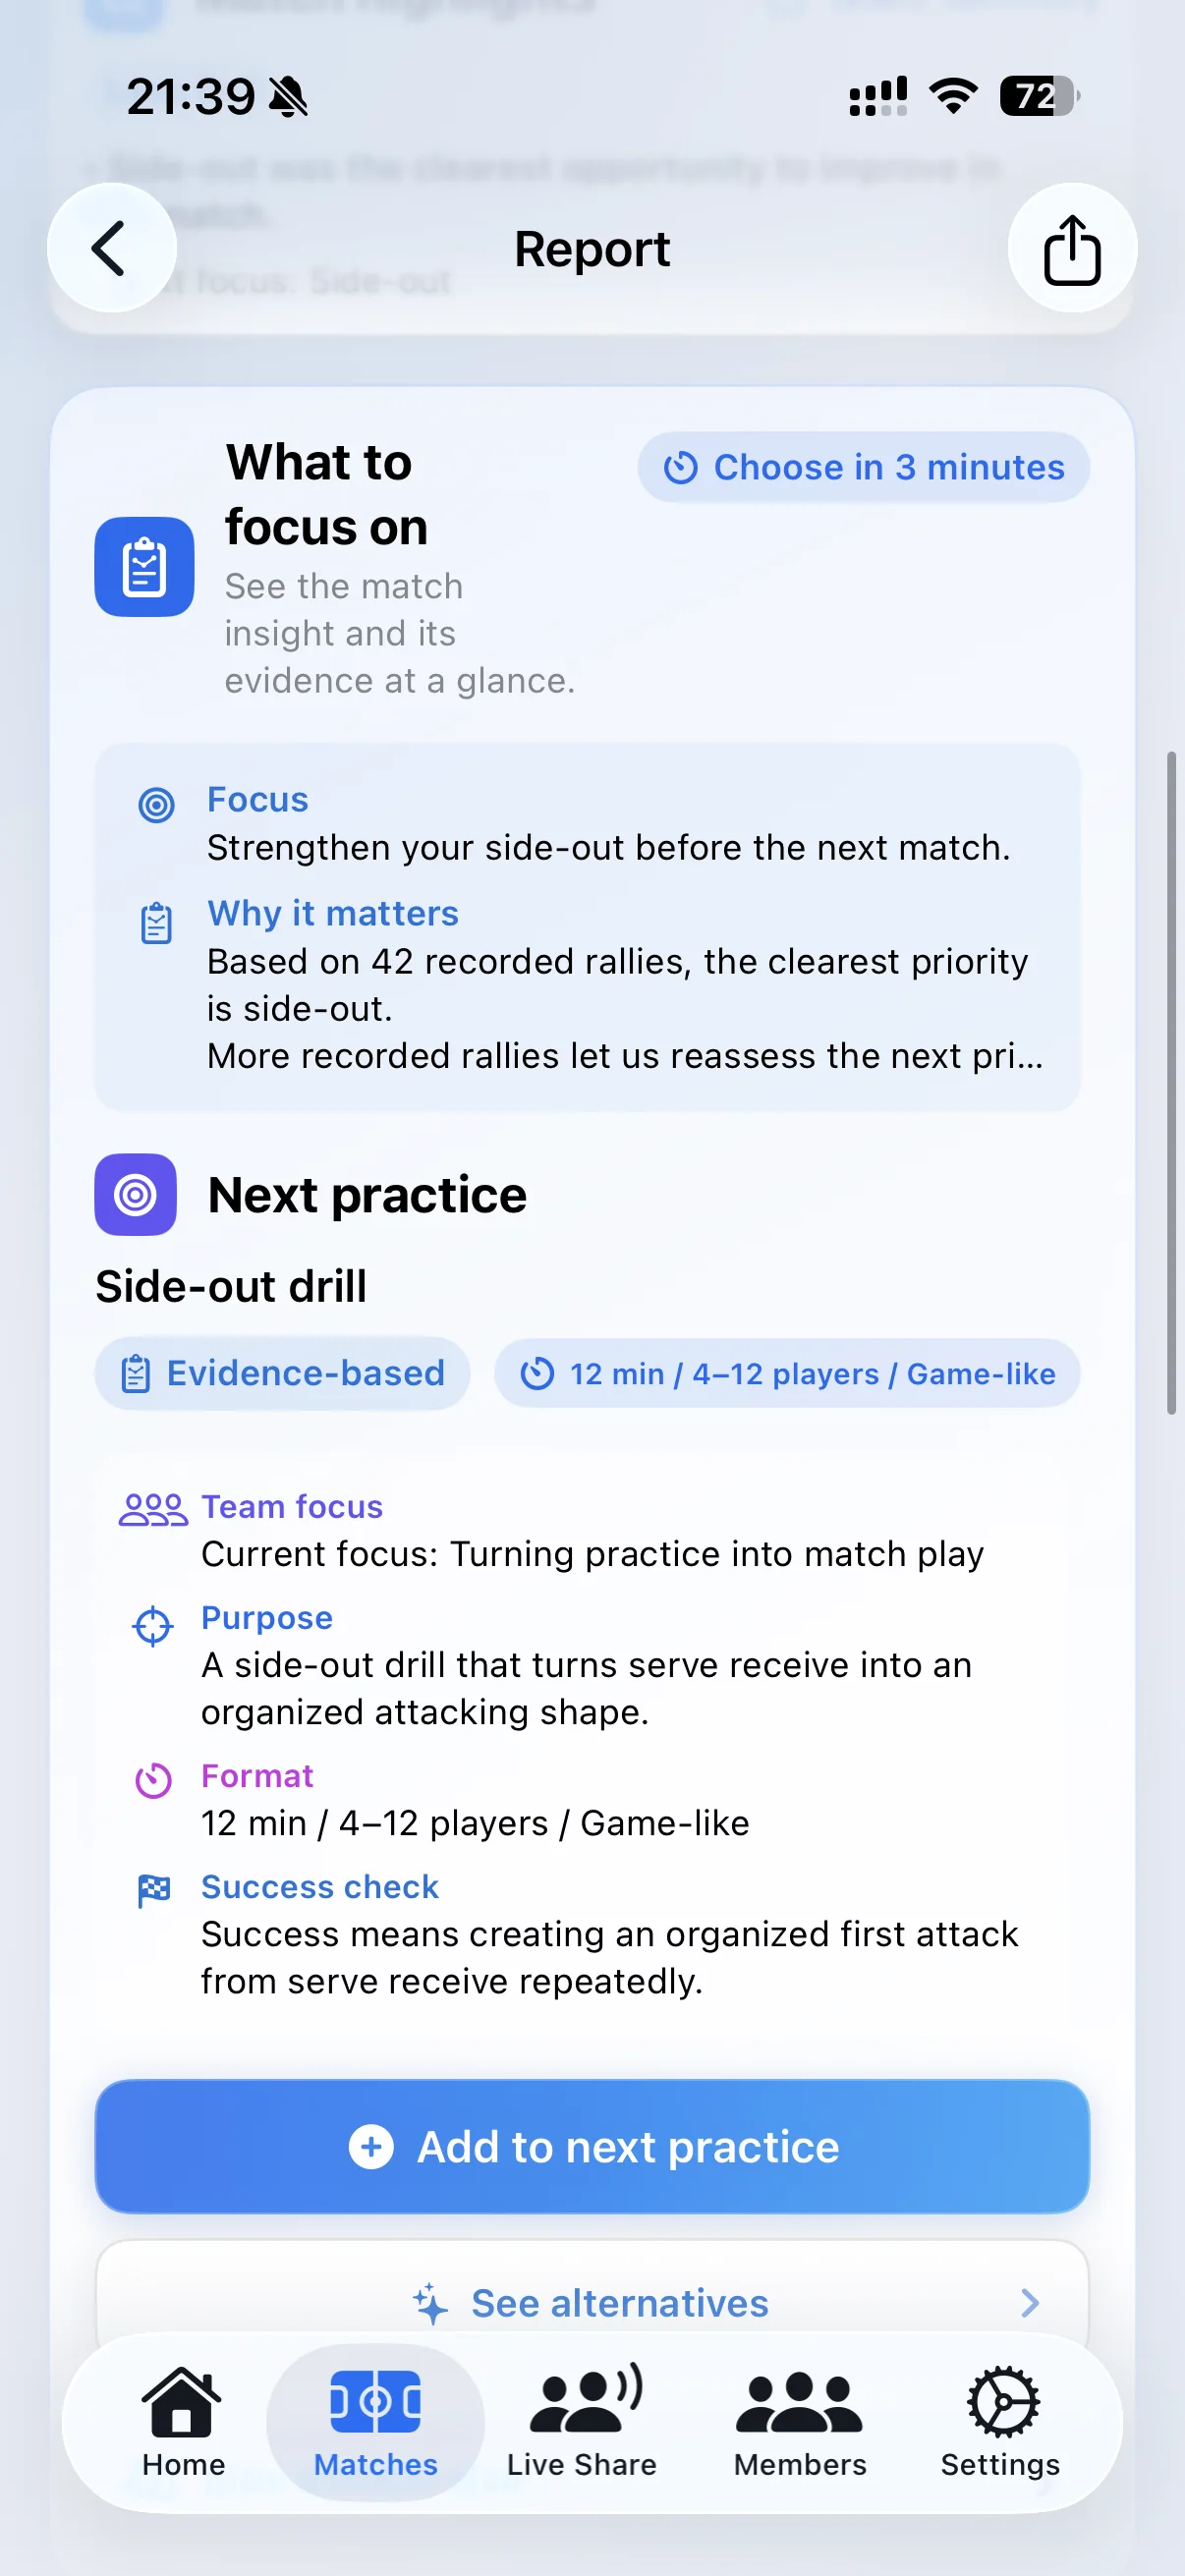
A useful review has three parts: the issue, the evidence and the response. The staff may begin with a poor side-out result, inspect the score flow and rotation, then discover that difficult seam serves repeatedly removed the first-tempo option. That is enough to write a specific practice brief.
- Issue
- Side-out became unstable during one repeated receiving pattern.
- Evidence
- Reception grades fell during a five-point run in Rotation 5.
- Practice response
- Recreate the same seam pressure and score the drill when first contact preserves two attack options.
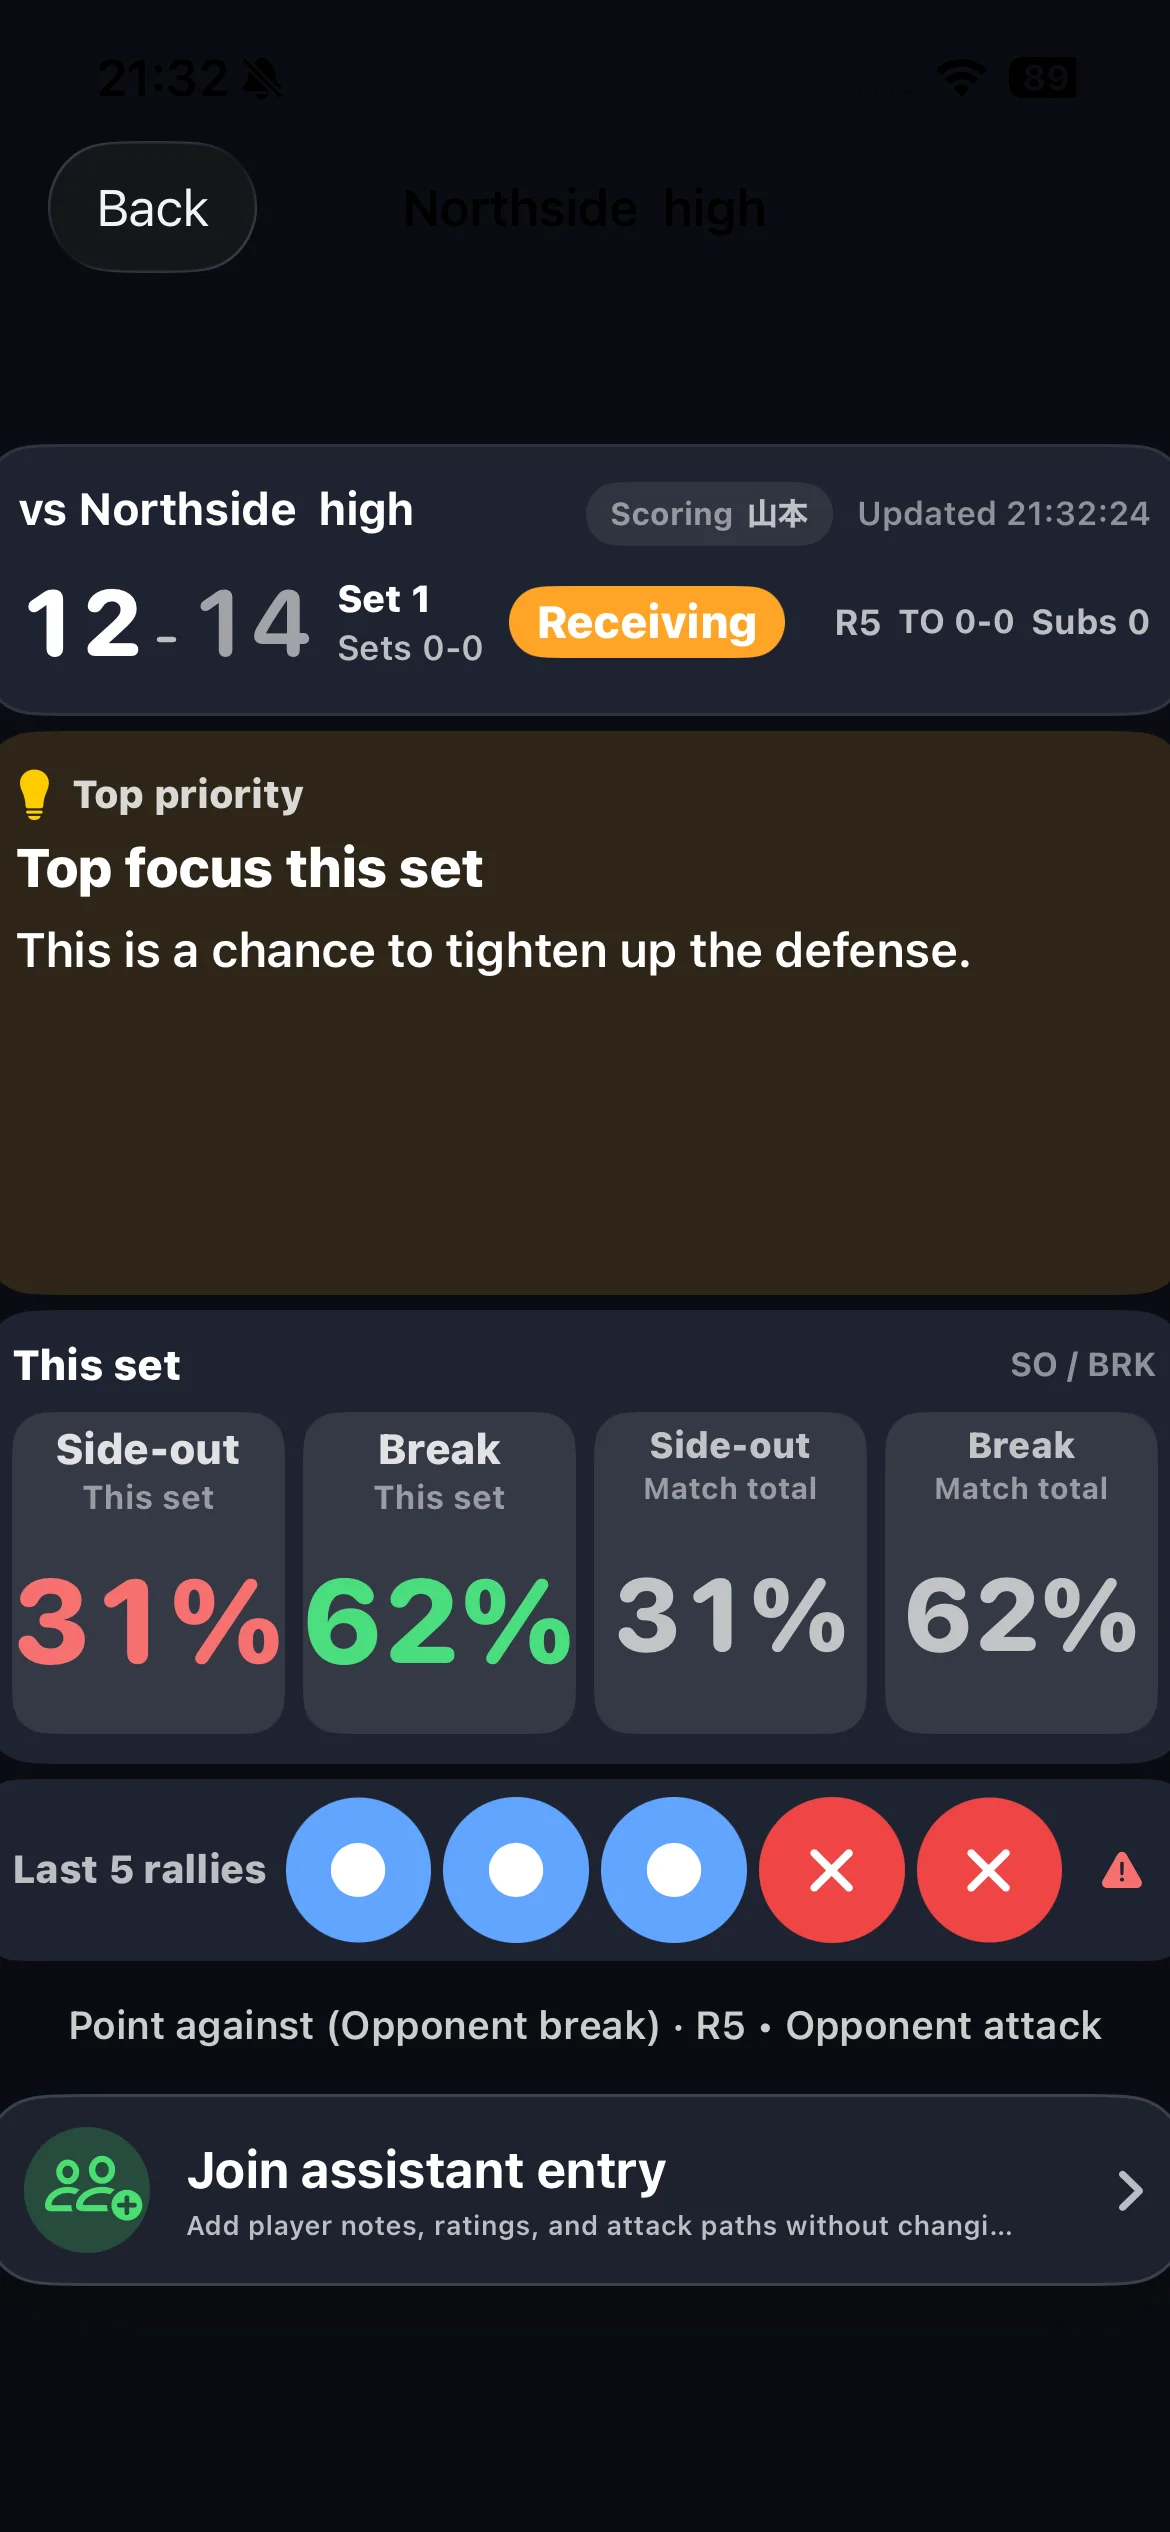
Vollyze is designed around this team-first sequence. One device can own the score while optional assistant entry adds player notes, serve-receive ratings or attack paths. The live view keeps phase and recent rallies visible. After the match, the report connects the clearest team pattern to a suggested next practice.
Frequently asked questions
What are the most important volleyball statistics for coaches?
Start with score flow and the smallest set that explains the next decision. Serve-receive, side-out, break-point, scoring runs and rotation context are often more usable than a large individual stat list.
How is volleyball hitting percentage calculated?
Subtract attack errors from kills, then divide by total attack attempts: (K - E) / TA.
How is volleyball passing average calculated?
On a 0-3 scale, multiply each reception count by its rating, add the points and divide by total receptions. Define the grades before comparing results.
What is the difference between side-out and break-point rates?
Side-out percentage measures rallies won while receiving. Break-point rate measures rallies won while serving. Keep the two samples separate.
Are volleyball stat abbreviations the same everywhere?
Core box-score abbreviations are widely used, but grading systems and software labels can vary. Confirm the definitions behind any report before comparing teams or seasons.
Is there a printable volleyball statistics cheat sheet?
Yes. Download the free one-page Volleyball Statistics Quick Reference for common abbreviations, formulas and a simple three-step interpretation workflow. No sign-up is required.
Record only what helps your staff decide.
Download Vollyze in English, start free and test the match-to-practice workflow with one real match.