Free coaching tool
Volleyball serving percentage calculator: separate consistency from pressure
From the Vollyze product team. This calculator keeps serve-in rate, ace rate, error rate and points won while serving separate, so one convenient number does not hide how the serve affected the rally.
Volleyball serving percentage can mean more than one thing. Some teams mean the percentage of serves kept in bounds. Others use an efficiency score that rewards aces, penalizes errors or grades how much pressure the serve created. Those results should not be compared until the formula is clear.
The calculator below starts with objective box-score outcomes. It then adds an optional break-point field for the result that matters most to team flow: how often the serving team won the rally.
Four clear rates
Serving percentage calculator
Enter total serves, aces and errors. Add points won while serving when you also want break-point rate.
- Ace percentage
- --
- Error percentage
- --
- Net ace efficiency
- --
- Break-point rate
- Optional
- Ace / error ratio
- --
- In-play, non-ace serves
- --
Add total serves or load the example.
Serve-in formula (total serves - service errors) / total serves
The short answer
Use more than one rate when the coaching question changes.
Serve-in percentage describes consistency. Ace and error percentages describe the two terminal outcomes. Break-point rate describes whether the whole serving phase produced points.
- Consistency Serve-in percentage.
- Risk Ace rate beside error rate.
- Team effect Break-point rate.
What does serving percentage mean in volleyball?
For a simple team stat, serving percentage usually means the share of service attempts that do not end in a service error. Thirty attempts with four errors produce 26 successful serves and an 86.7% serve-in rate.
The NCAA distinguishes three outcomes for every served ball: a service ace, a service error or a zero serve that continues play. Its current box-score instructions define an ace as a serve that directly results in a point and a service error as a serve that immediately ends the rally against the serving team.
Official reference: NCAA volleyball box-score instructions.
Serving percentage formulas, side by side
Write the formula beside the result whenever staff members, players or software systems exchange serving data. The same label can otherwise describe different measurements.
- Serve-in percentage
- (Total serves - service errors) / total serves. Measures consistency.
- Ace percentage
- Aces / total serves. Measures direct terminal pressure.
- Error percentage
- Service errors / total serves. Measures immediate cost.
- Net ace efficiency
- (Aces - service errors) / total serves. A simple net-terminal rate used on this page.
- Break-point rate
- Points won while serving / total serves. Measures the whole serving phase.
Example: five aces and four errors on 30 serves
The example produces an 86.7% serve-in rate, a 16.7% ace rate and a 13.3% error rate. Net ace efficiency is 3.3%, because the server created one more direct point than direct error across 30 attempts.
If the team won 12 of those 30 serving rallies, break-point rate is 40.0%. Seven of those points came after the serve was returned, so the team result contains information that ace rate alone misses.
Why "serve efficiency" needs a label
There is no single universal serve-efficiency formula across every scouting platform. This page uses the explicit label net ace efficiency for (aces - errors) / attempts. Professional and coded scouting systems may also credit overpasses, poor passes or graded positive serves.
For example, the Pro Volleyball Federation describes an efficiency measure that includes good serves as well as aces and errors. That result should not be compared directly with a net ace calculation unless both systems use the same event grades.
Formula reference: Pro Volleyball Federation statistics explained. For service-attempt and error-rate definitions, see Hudl's volleyball stats guide.
Why break-point rate changes the coaching conversation
An aggressive serve can create value without becoming an ace. It may force an out-of-system set, remove a quick attacker or give the block-defense system a predictable ball. Break-point rate captures the final rally result, while ace and error percentages describe only the terminal serve outcomes.
What is a good serving percentage?
A universal target can create the wrong behavior. A beginner team may first need a stable serve-in rate. An experienced team may accept more errors when a server consistently reduces the opponent's side-out quality. Use a comparable sample from the same level, role and tactical instruction.
- Compare the same server across enough attempts, not one short run.
- Keep ace rate and error rate visible beside serve-in percentage.
- Check break-point rate before deciding that an in-bounds serve was effective.
- Separate a tactical target miss from an unforced service error when video or notes are available.
- Review which rotations and score states changed the serving risk.
Turn the rates into one practice constraint
Choose the practice response from the part of the profile that changed. Avoid asking every server to "serve harder" or "just get it in" without identifying the tradeoff.
- If error rate rose without more break points
- Reduce target difficulty, stabilize the toss and rebuild the same tactical zone under a score constraint.
- If serve-in rose but break-point rate fell
- Train a target or trajectory that removes an attacker instead of rewarding safe center-court serves.
- If one rotation created a run
- Recreate the opponent's receiving shape and connect the serve target to the planned block-defense response.
A measurable practice condition might be: "Across 20 pressure serves to the left seam, keep error rate below the last match while producing at least six out-of-system first contacts." The match metric selects the problem; the drill still needs a visible volleyball behavior.
Frequently asked questions
How do you calculate serving percentage?
Subtract service errors from total serves, then divide by total serves for the serve-in percentage.
How do you calculate ace percentage?
Divide aces by total service attempts.
What does net serve efficiency mean here?
This page uses (aces - errors) / attempts and labels it net ace efficiency. Confirm the formula before comparing another system.
What is break-point rate?
It is the percentage of service attempts after which the serving team wins the rally.
Should youth teams chase one serving benchmark?
No. Start with consistent records from the same team, age and tactical role, then compare the profile over time.
See what happened after the serve.
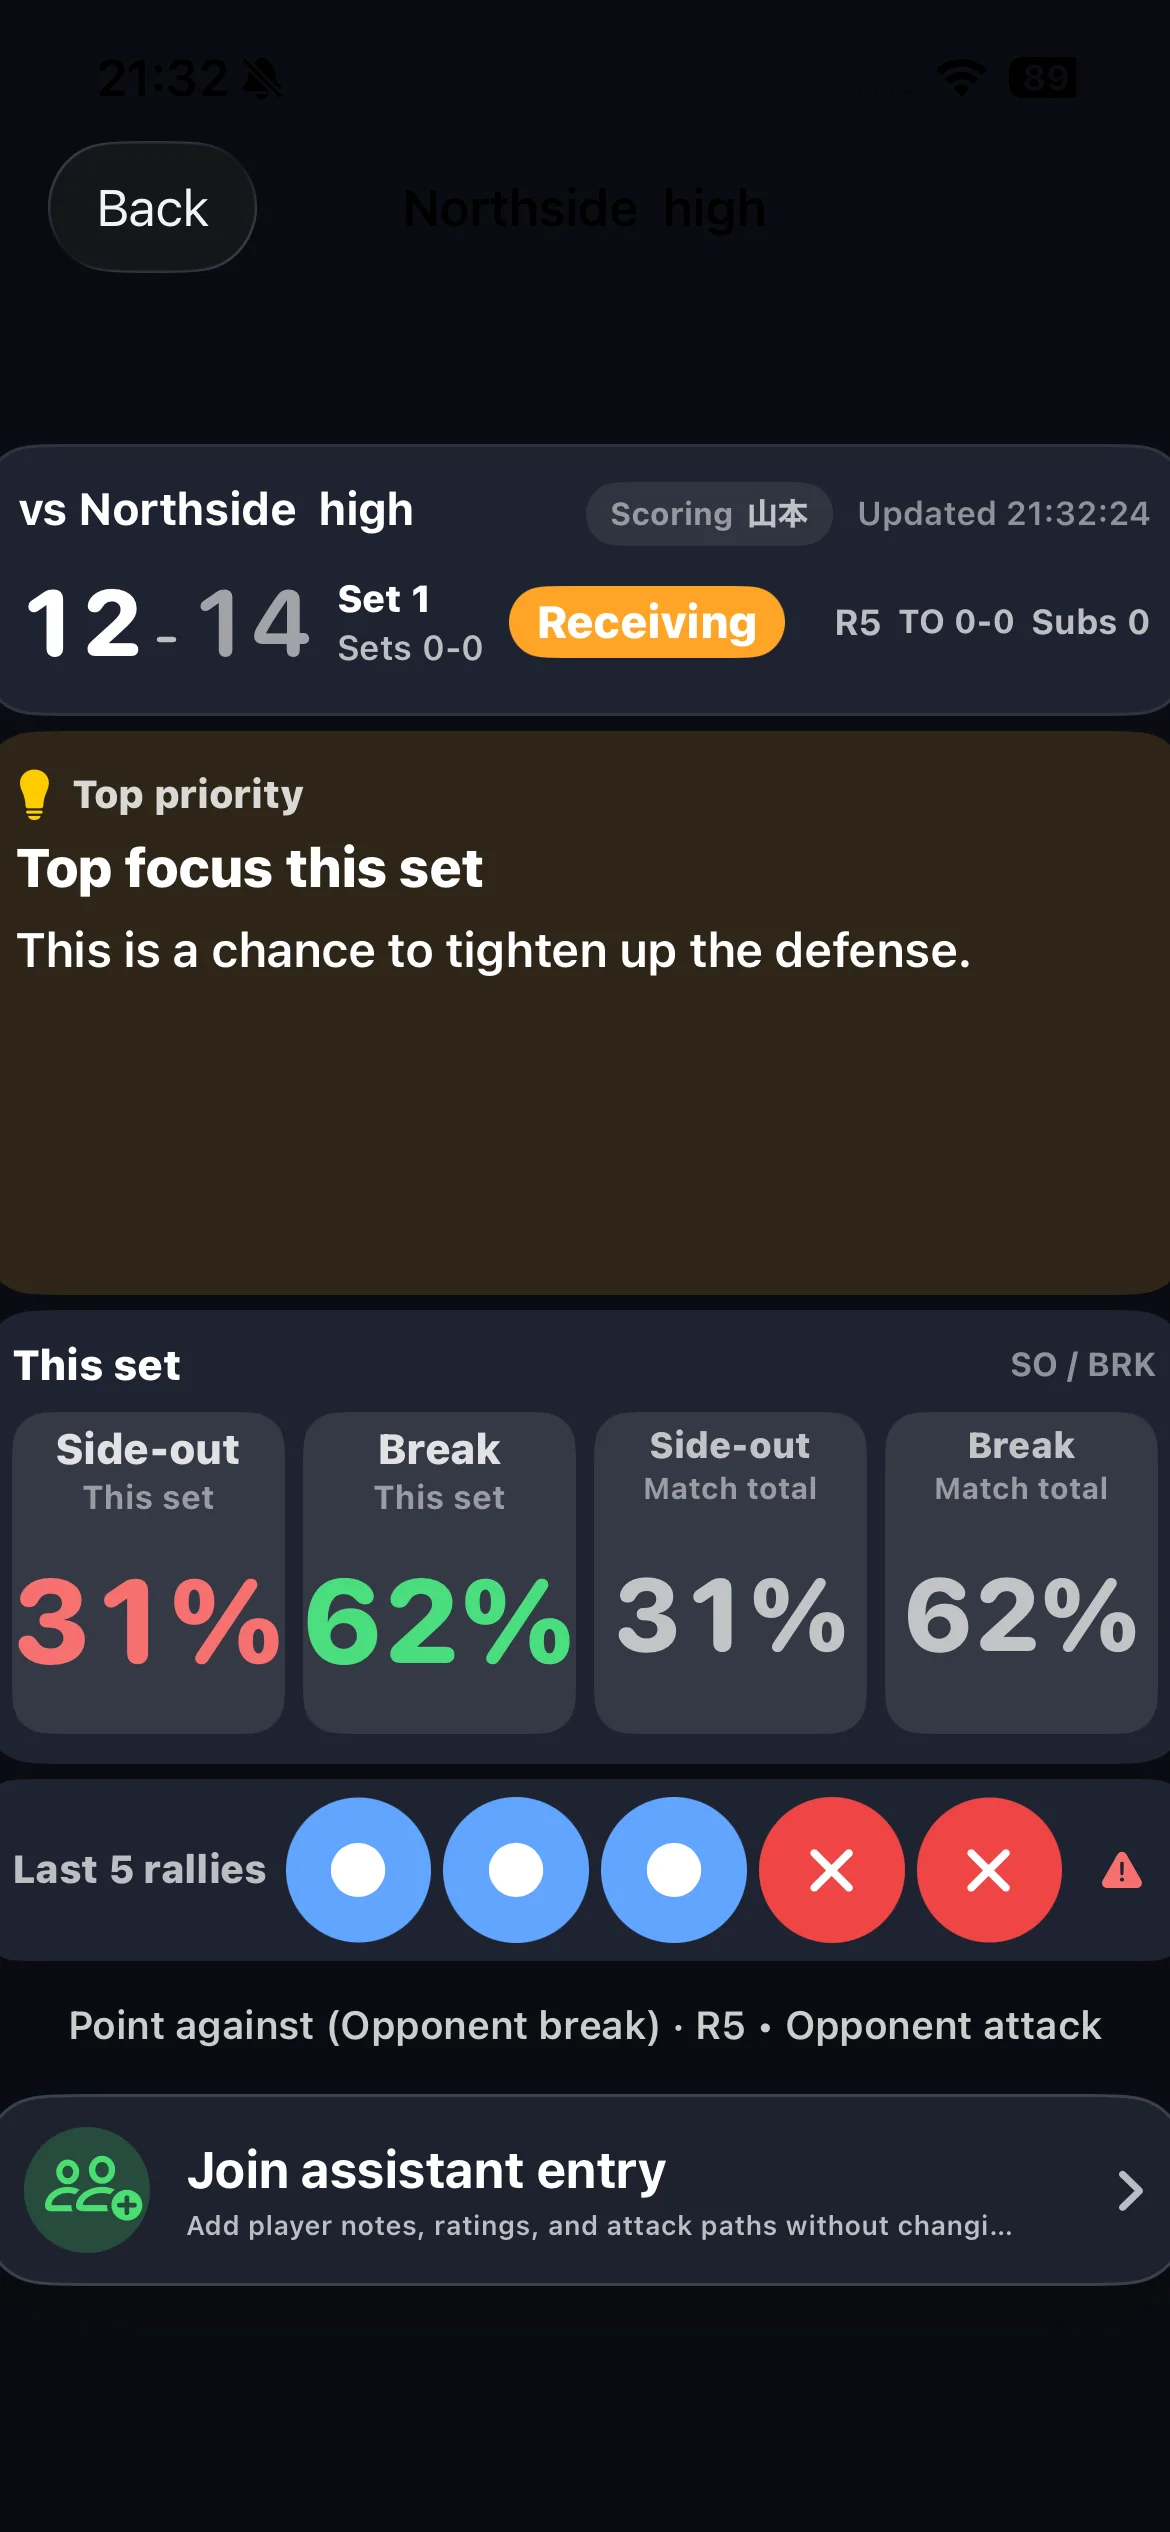
Vollyze records the score first, keeps the serving phase and recent rallies visible, and helps the staff turn one team pattern into the next practice focus.