Volleyball match metrics
Volleyball side-out percentage: meaning, formula and calculator
From the Vollyze product team. The examples below follow the side-out, break-point and serve-receive context shown in the real English-localized screens.
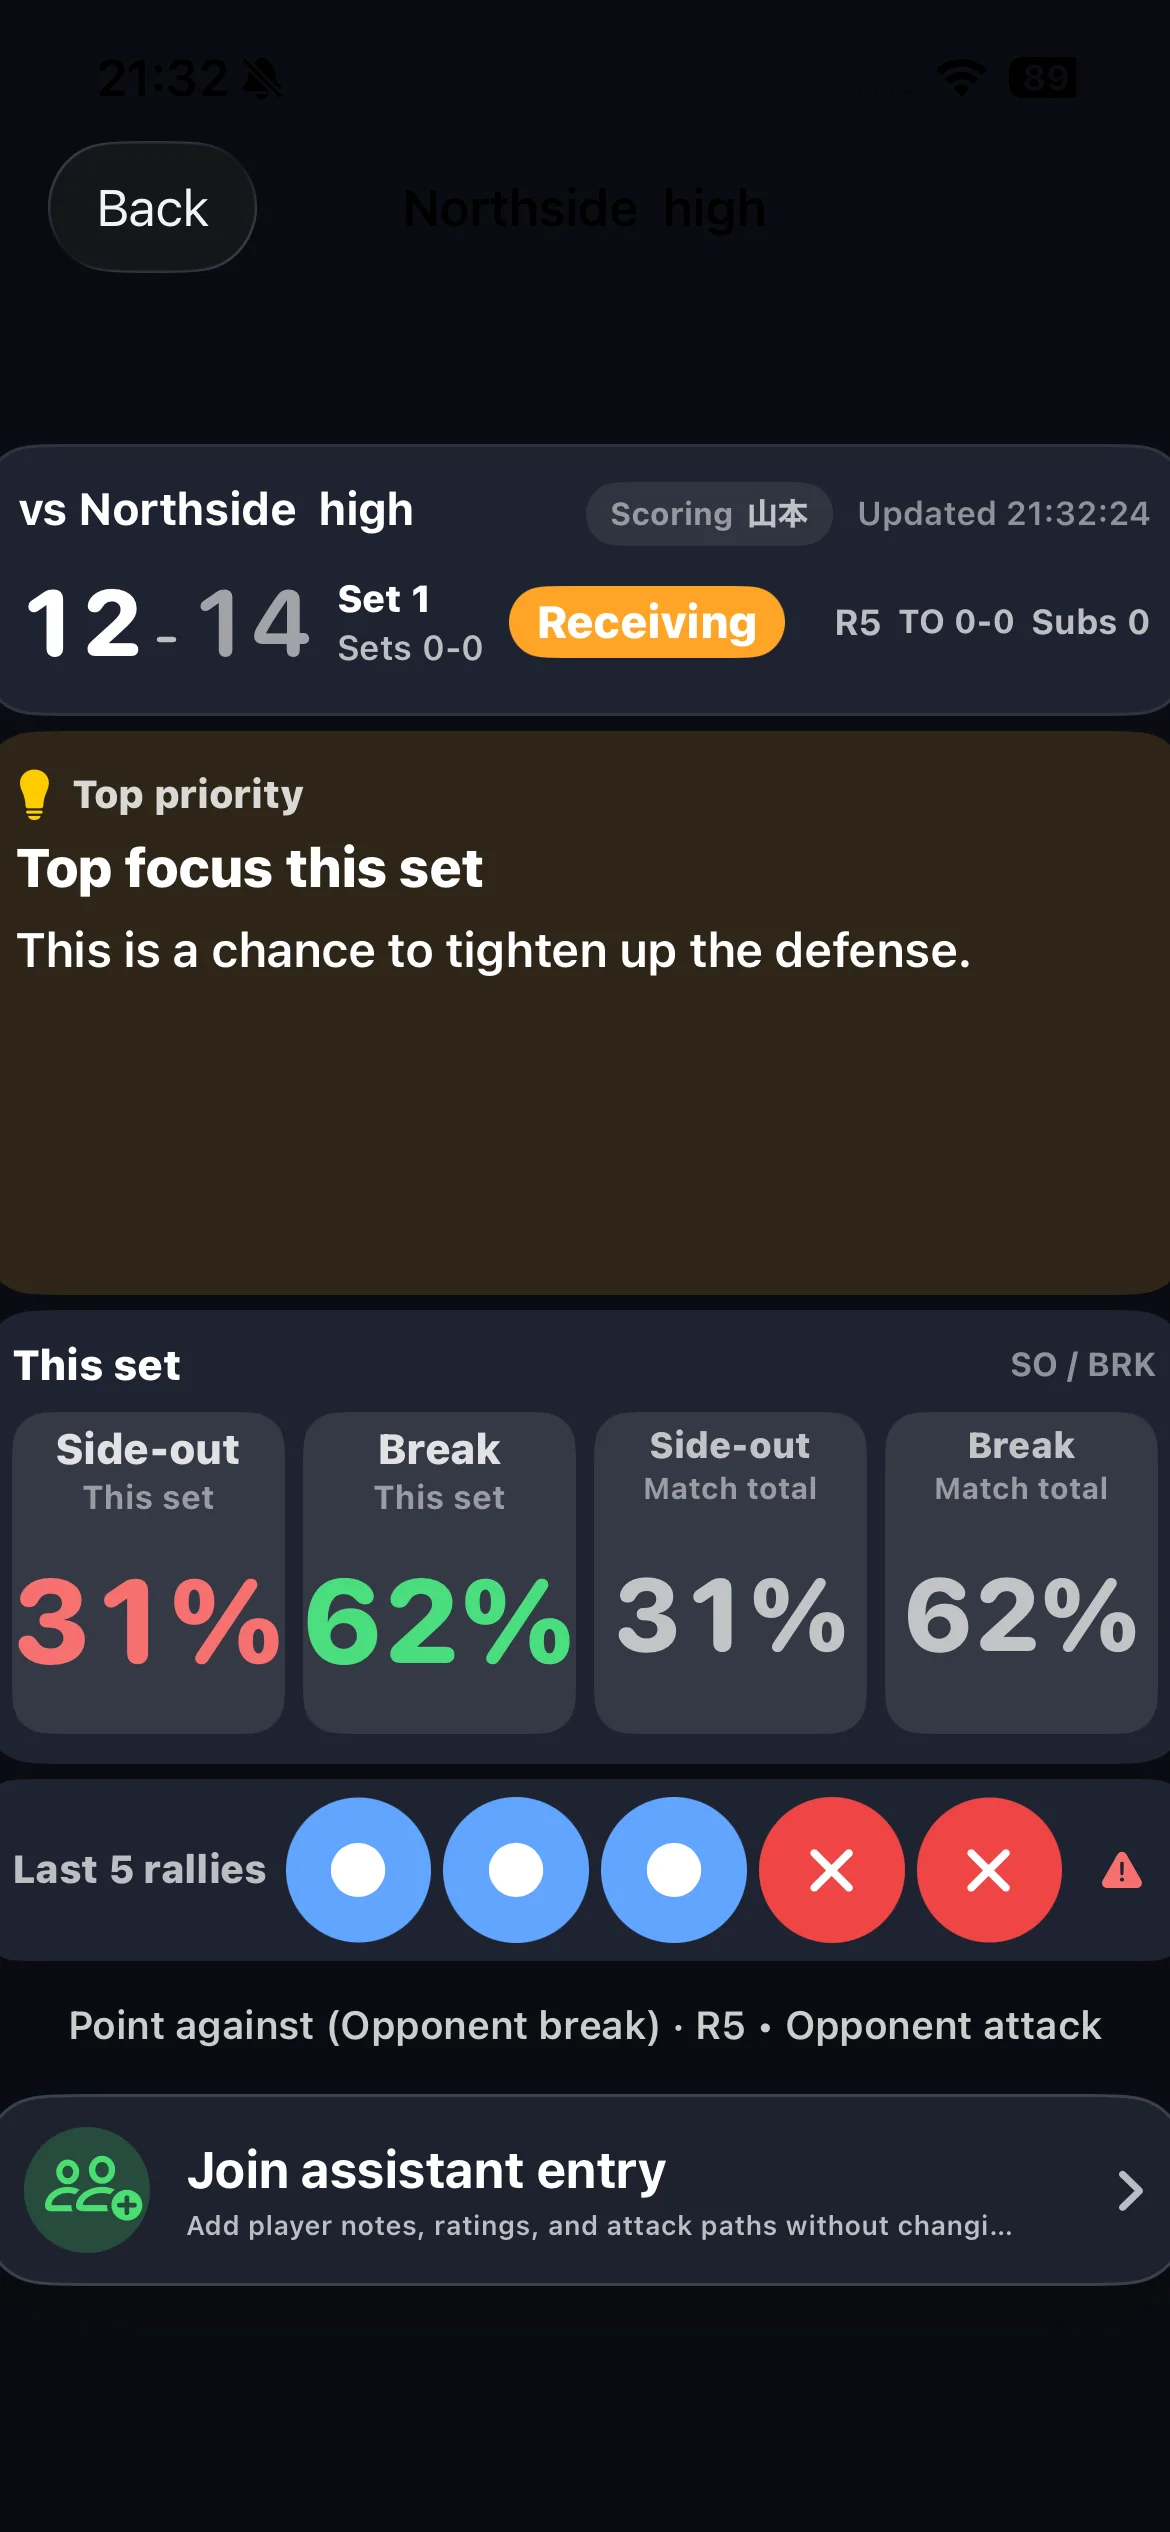
- Side-out percentage measures rallies won while receiving serve.
- Break-point rate measures rallies won while serving.
- Always check the denominator and sample size before comparing percentages.
- Review the rate with rotation, serve-receive quality and scoring runs.
A side out in volleyball means the receiving team won the rally, scored a point and gained the right to serve. Side-out percentage is the share of all serve-receive rallies that end this way. It separates the receiving phase from the serving phase so the staff can ask a more precise question than the final score alone can answer.
The number should not be treated as a grade by itself. A team may have the same percentage in two matches for very different reasons: direct reception errors, predictable high balls, poor attack decisions, or a strong opponent transition. The rate shows where to look. The rally context explains what to coach.
The short answer
A side out is a rally won by the team receiving serve.
Use side-out percentage with the number of receiving rallies, the rotation and what happened after first contact. Compare break-point rate separately because it uses serving rallies as its denominator.
- Meaning Receive, win the rally, earn serve
- Receiving Side-out percentage
- Serving Break-point rate
What does side-out mean in volleyball?
In modern rally scoring, a team scores a point on every rally. Coaches still use side-out to describe winning a rally while receiving serve. The receiving team wins the rally, gains the next serve and rotates.
Terminology can vary between countries, software and coaching teams. Some systems use terms such as point-scoring percentage or phase-one efficiency. Before comparing reports, confirm that both systems use the same receiving-rally denominator.
How to calculate side-out percentage
Example: 18 side-outs from 40 receiving rallies = 45%.
The denominator includes all rallies in which your team received the serve. If the receiving team wins 18 of 40 such rallies, its side-out percentage is 45%. Keep the count visible: 45% from 40 rallies is more informative than 45% without the sample.
When reviewing sets, be careful with very small samples. One strong or weak rotation can move a set percentage sharply. A match total, several recent matches and rotation-level views answer different questions; do not present them as interchangeable.
How break-point rate differs
Example: 14 points won from 35 serving rallies = 40%.
When your team serves and wins the rally, it earns a break point and continues serving. Break-point rate describes how often the serving phase produces a point. Depending on the system, you may see the label shortened to break rate or point-scoring rate.
| Metric | Phase | Numerator | Useful coaching question |
|---|---|---|---|
| Side-out % | Receiving | Rallies won while receiving | Can first contact become a point before the opponent builds serving pressure? |
| Break-point rate | Serving | Rallies won while serving | Can our serve and transition turn pressure into consecutive points? |
Free coaching tool
Side-out and break-point calculator
Enter the rallies won and the total rallies for each phase. The percentage and sample update as you type.
Rule context: the FIVB basic rules explain that a receiving team earns a point, the right to serve and a rotation when it wins the rally. The calculator is a coaching aid, not an official scoresheet.
Connect side-out to serve-receive quality
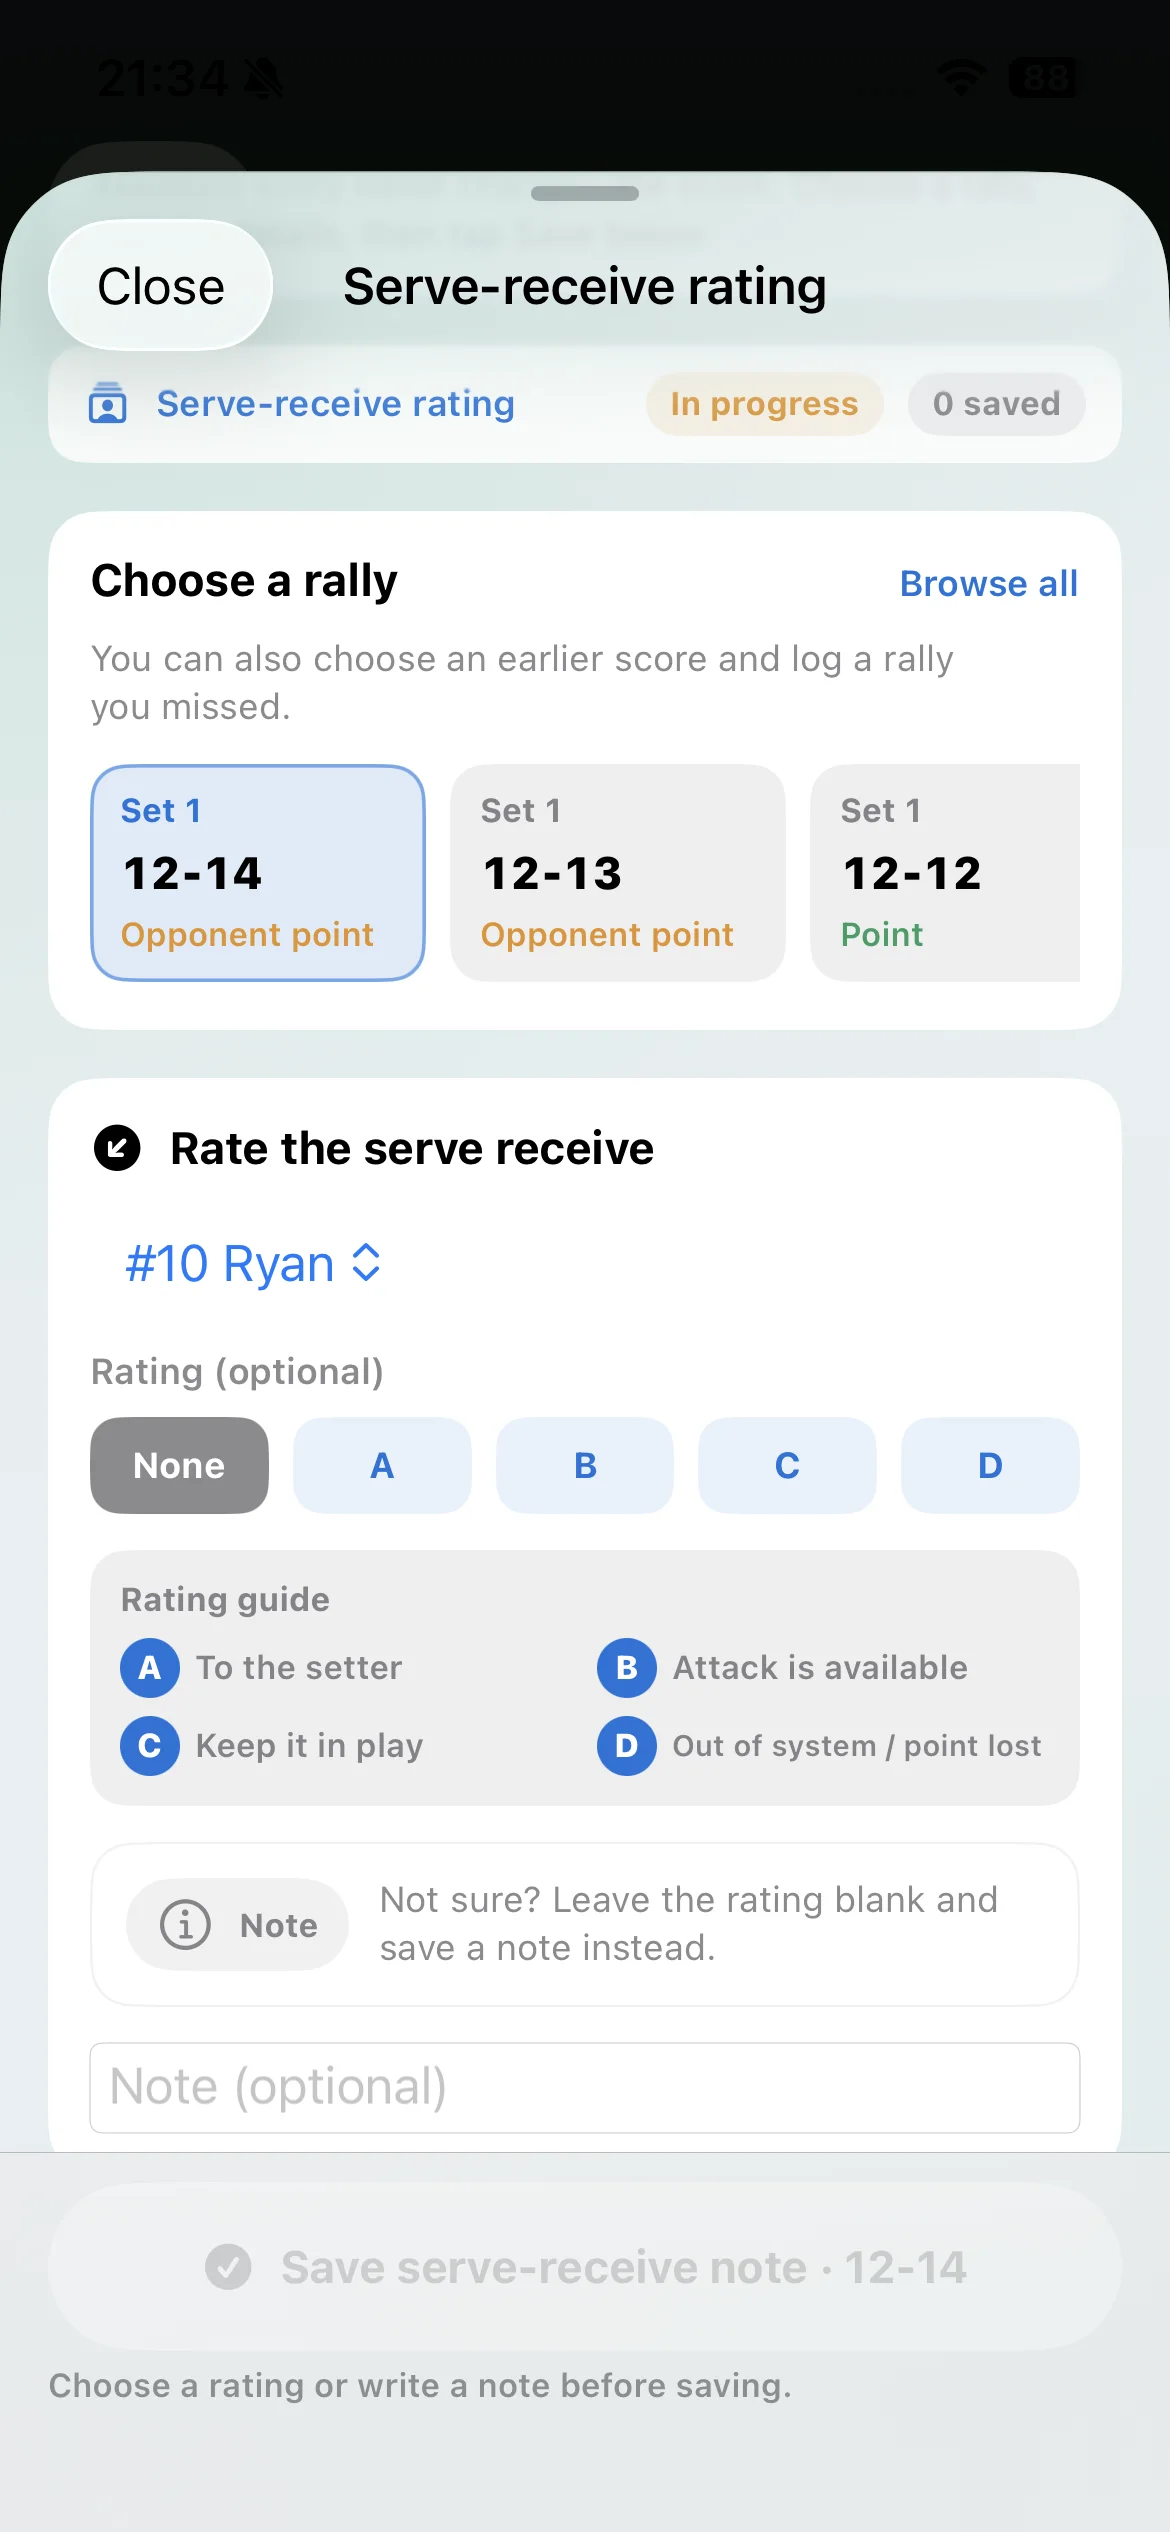
A pass grade helps explain what options were available after reception. An A pass may reach the setter in system; a lower grade may limit the attack or force the team to keep the ball alive. The exact A/B/C/D definitions vary, so every staff should agree on its rating guide before comparing players or matches.
Do not assume an A pass guarantees a side-out or that a difficult pass makes one impossible. Review the sequence: first contact, available attack, decision and rally result. This shows whether the main issue is reception quality, the connection to the setter, attack choice or transition after the first swing.
Review the percentage by rotation and situation
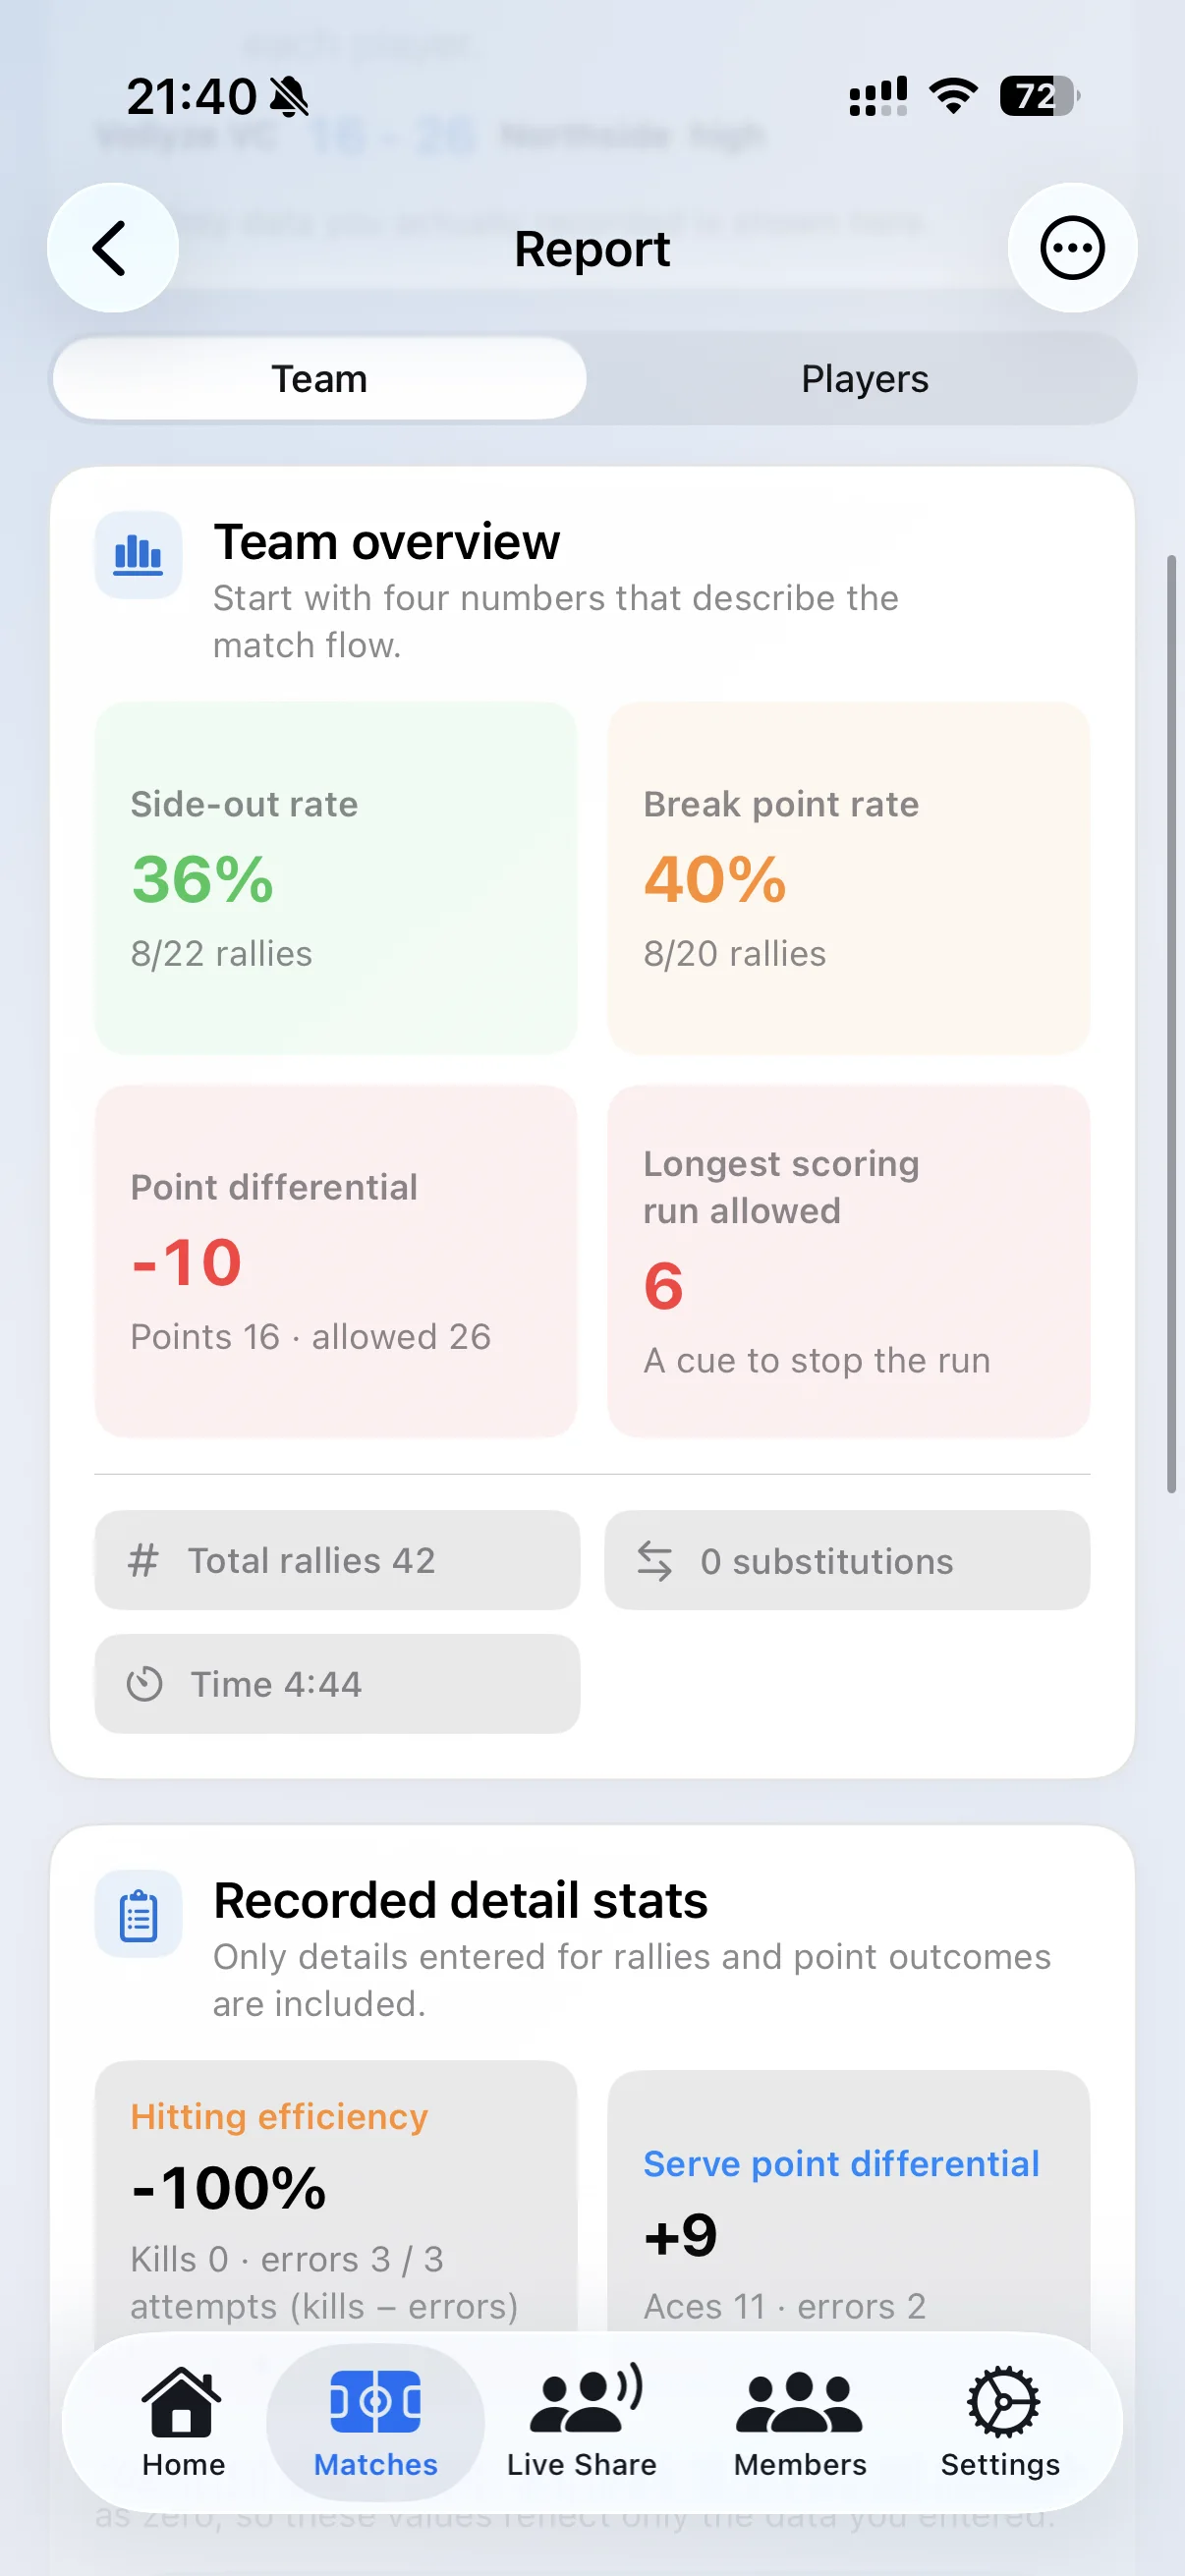
A match-level side-out percentage is a starting point. Rotation context can reveal whether the pressure repeats with a particular lineup, receiver pattern or set of attacking options. The purpose is not to label a rotation as bad. It is to identify the situation the team needs to solve. The rotation analysis guide shows how to move from the number to that situation.
- Compare the same rotation across enough receiving rallies.
- Check whether the opponent targeted one receiver or zone.
- Review whether the setter retained multiple attacking options.
- Look for scoring runs, not only isolated lost rallies.
- Note tactical changes that changed the context mid-set.
What is a good side-out percentage?
There is no single benchmark that is useful for every age group, competition level, opponent strength and sample size. Public figures may use different definitions or data-cleaning rules. A number from an elite competition should not automatically become a target for a youth or school team.
A safer starting point is internal comparison: the same team over time, the same rotation in similar contexts and the same serve-receive rating system. Ask whether the rate is stable, whether the sample is large enough to discuss and whether the observed change matches what coaches saw on court.
Turn the number into a practice decision
Once the weak receiving context is identified, write the practice response in concrete terms. Avoid a broad instruction such as “improve side-out.” Name the serve pressure, the receiving shape and the first attack the team needs to repeat.
- Issue
- Side-out became unstable when the opponent served the seam in Rotation 3.
- Evidence
- The receiving sample, first-contact ratings and scoring run point to the same situation.
- Practice response
- Recreate that serve target and connect the reception to two available first-attack options.
Frequently asked questions
What is side-out percentage?
It is the percentage of rallies your team wins while receiving serve.
How is it calculated?
Divide rallies won while receiving by all serve-receive rallies, then multiply by 100.
What is break-point rate?
It is the percentage of rallies your team wins while serving, using serving rallies as the denominator.
What is a good percentage?
Use team, level and sample context rather than one universal benchmark. Compare your own team consistently and inspect the rally situations behind the change.
See side-out and break-point context in your own match.
Vollyze keeps side-out, break-point and rotation context close to the score, then connects the report to the next practice.